predicting house prices
uc berkeley | machine learning
Contributors: Allison Godfrey, Ian Anderson, Jacky Ma, and Surya Gutta
Project Description
The House Price Prediction Kaggle competition is based on the Ames Housing Dataset. The goal of this project is to predict sale price of homes on the given training and test data sets containing 90 features of each home. In this Final Notebook, my team and I used machine learning approaches to try to most accurately predict home price based on relevant features.
The main components of the notebook are:
- EDA and data cleansing
- Outlier analysis
- Replace missing values
- Exclude columns over 10% missing values
- Feature Engineering
- Univariate and Bivariate analysis of explanatory features
- Encode categorical and ordinal features
- Transform skewed variables (features and outcome variable)
- Data split -
- 80% train, 20% dev
- 5-fold Cross Validation
- Model Building
- Bayesian Ridge Regression
- Lasso Model
- Bayesian ARD Regression
- Elastic Net Regressor
- Theil-Sen Estimator
- Ordinary Least Squares Linear Regression
- Random Forest Regressor
- XGB Regressor
- Ada Boost Regressor
- Blended Model
- Assessment of individual and blended models
- Adjust model weights
- Overfitting versus generalization analysis
Skills
Machine Learning, Data Cleansing, Correlation Analysis, Feature Engineering
Tools
Python, SciKit Learn, Jupyter Notebooks, Matplotlib
Results
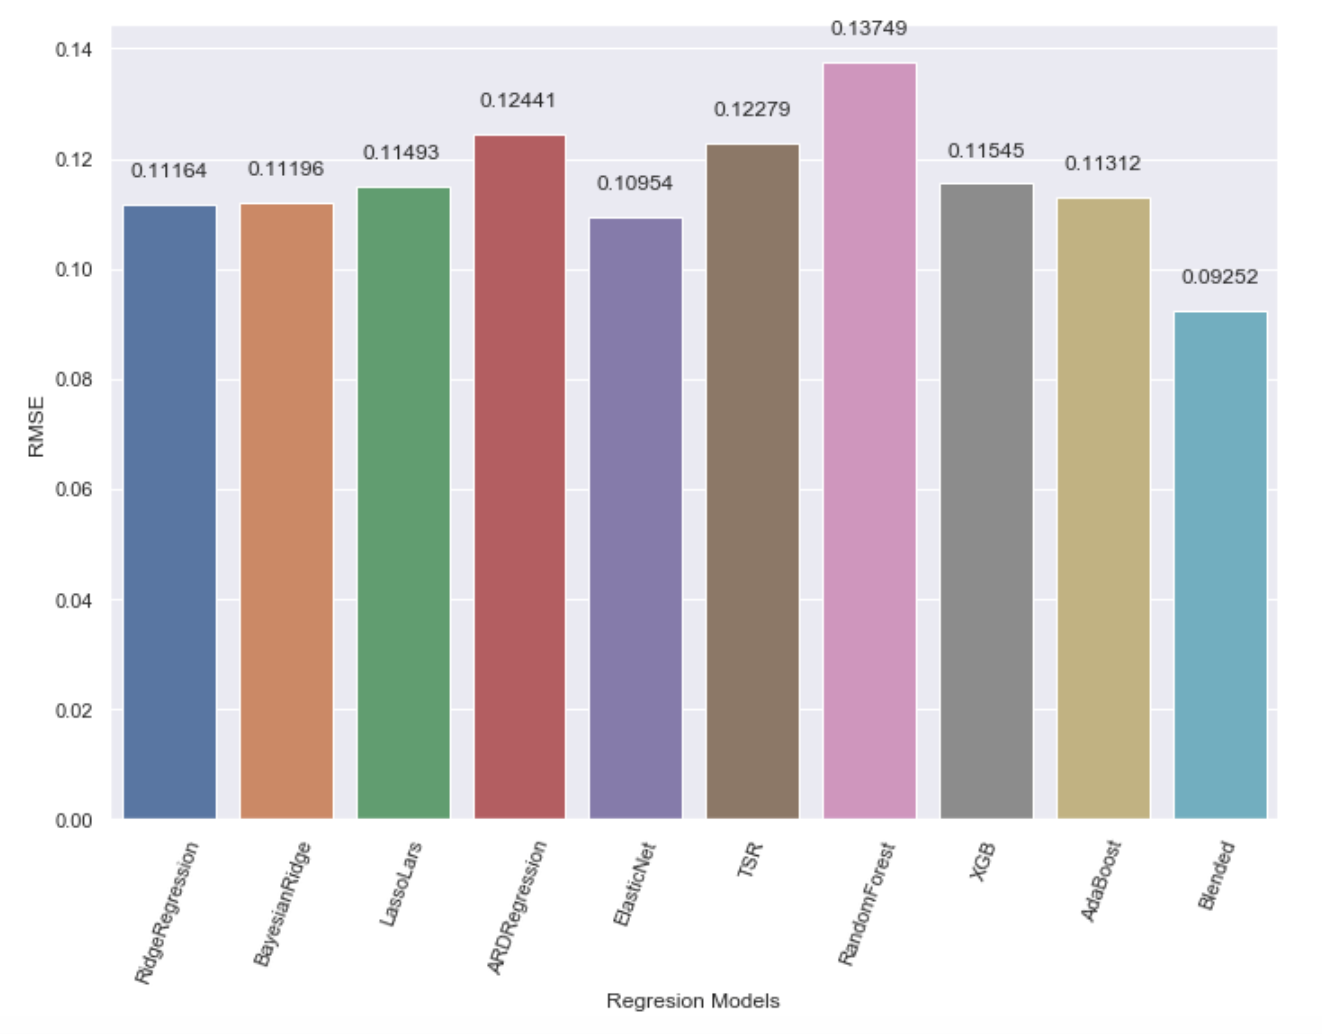
We measured each model’s accuracy by its Root Mean Squared Log Error (RMSLE). Looking at the following chart, the RMSLE was lowest in our Blended Model with a distinct set of model weights. This RMSLE (0.09252) achieved our best competition score, but was not our lowest RMSLE within our notebook, illustrating that our models were prone to overfitting. The RMSLE of 0.09252 represents our best balance between overfitting and generalizability.

Summary
From the beginning, our focus was more on know your data. Therefore, we were very intentional about how we encoded each categorical and ordinal feature, how we assigned missing values, how we aggregated some features to avoid multicolinearity, and how we iteratively performed our feature selection process. See the following Slide Deck to discover more about our iterative process and some further extensions of the model.
We started at a Kaggle placement of 3500 and have worked our way up to a placement of 525 (top 12% of submissions).